EDR January 14, 2026 v12640 release notes
NOTE Datto EDR leverages a staggered release process. You'll receive an in-product notification when these updates are available to your instance.
Version information
| Endpoint Security Agent | Ransomware Agent | Rollback Agent | API |
|---|---|---|---|
|
3.17.1.4429 |
1.5.1 |
1.4.0.191 |
5.0.0 |
New features
Datto AV report
You can now generate Datto AV reports to demonstrate the value of your endpoint protection to clients. The report provides a clear summary of AV activity, including:
- Top endpoints with the most alerts
- Top blocked security threats
- Overall detection overview
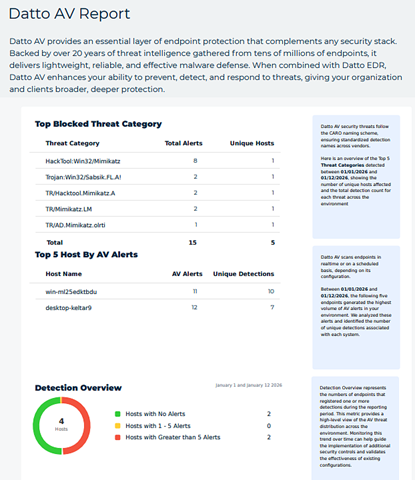
Use these insights to highlight protection outcomes, identify high-risk endpoints, and support value-driven conversations with your clients.
For information about creating a Datto AV report, see the article Navigating the Reports page.
DNS Secure report
You can now generate DNS Secure reports to provide actionable insights into your clients’ DNS security posture. The report highlights:
- Top blocked domains
- Top blocked security and content categories
- High-risk and well-behaved hosts by block rate
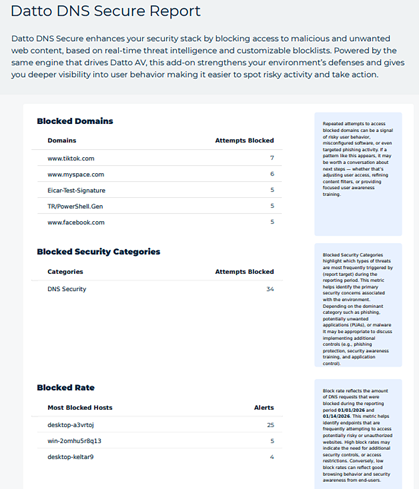
This makes it easier to demonstrate value, identify upsell opportunities, and recommend targeted security improvements.
For information about creating a DNS Secure report, see the article Navigating the Reports page.
Redesigned Dashboard
The Dashboard has been redesigned to provide a clearer view of license, alert, and agent information, as described below.
Licenses
The dashboard now includes an EDR Licenses widget and an AV Licenses widget that provide a real-time overview of your EDR and AV license usage. You can view the number of licenses in use, stale licenses, and remaining licenses. Clicking used or stale counts opens a filtered Devices page. License data refreshes automatically every 4 to 24 hours, ensuring you always have up-to-date information.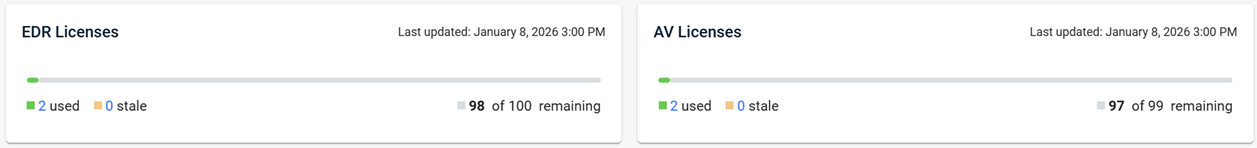
Alert activity
New daily and hourly alert widgets display the total number of created alerts, broken down by category (AV, Rule, Ransomware). These widgets auto-refresh on a regular schedule and allow you to click alert counts or chart dates to drill down into filtered alert tables, making it easier to spot trends and investigate issues in real time.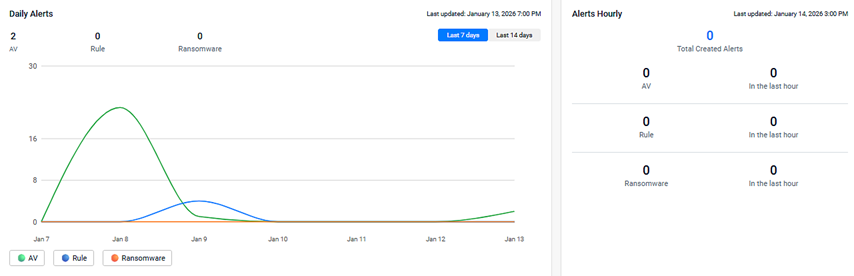
Agent activity
New daily and hourly agent widgets display the total number of agents by status (Active, Inactive, Stale). These widgets update automatically and allow you to drill down into device lists with a single click. This enhancement gives you greater visibility into your environment and helps you quickly identify changes in agent health and coverage.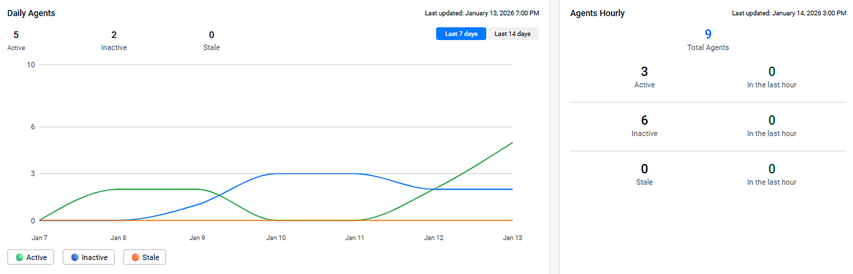
Other widgets
The following widgets are still part of the Dashboard and now include Last 7 days and Last 14 days filters:
- OS Breakdown
- Top Hosts by Alerts
- Quarantined Files
- Security Alerts by Status
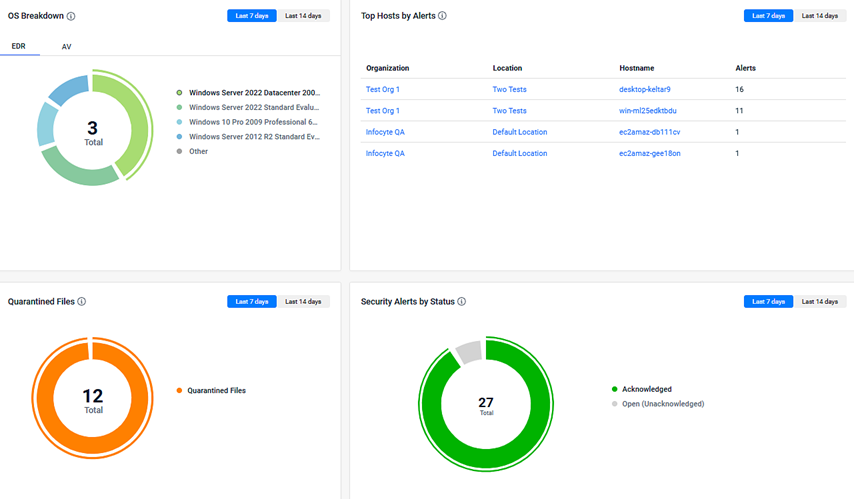
NOTE The Dwell Time widget has been removed from the Dashboard.
For more details about the redesigned Dashboard, see the article Getting started with the Dashboard page.
Manage agent via desktop user interface (UI)
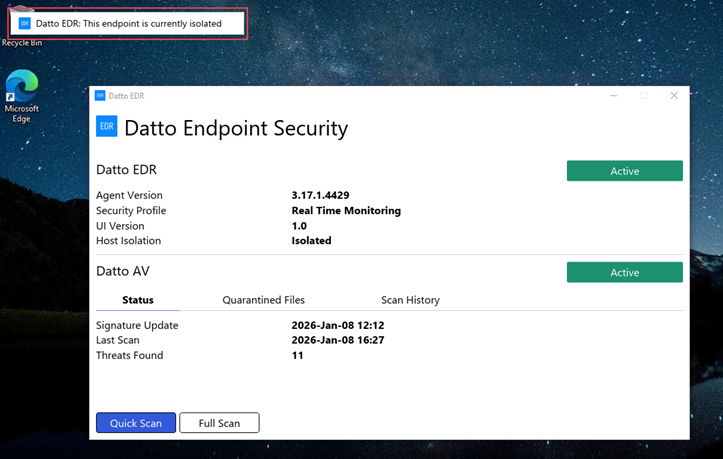
We’re excited to announce the Datto Endpoint User Interface, a new feature designed to give end users real-time visibility into their device’s security status and the ability to initiate key security actions directly from their desktop. Users can initiate scans, view threats, and monitor both EDR and AV status from a single interface.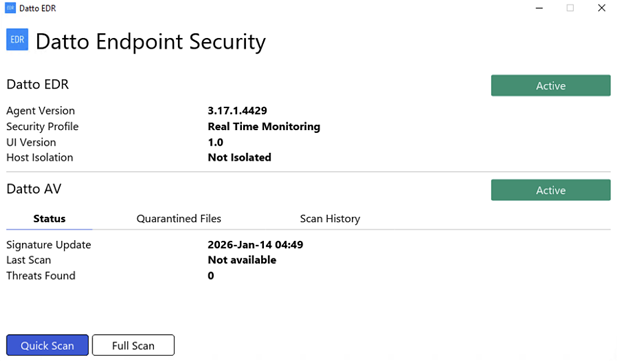
Tray Icon Integration and menu
The Datto EDR agent for Windows now includes a system tray icon, giving users a clear visual indicator of agent status directly from the Windows desktop. The tray icon provides real-time feedback and is designed to improve transparency and user awareness of endpoint protection. Clicking the tray icon opens a mini menu, allowing you to launch the full desktop interface and quickly determine the Status of Datto EDR/AV.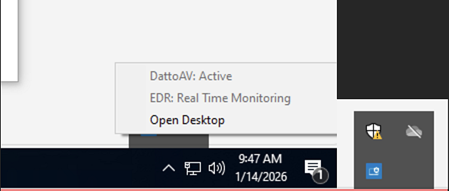
Agent notifications
New agent related banners are displayed under the following circumstances:
-
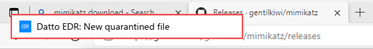
When a file is quarantined by Datto AV: The banner helps users quickly identify when a potential threat has been isolated, prompting them to review quarantine history in the desktop Interface. The banner only appears when the desktop UI is open or minimized and the AV policy is in Protect & Quarantine mode.
-
When a device is isolated by Datto EDR: The banner helps users quickly identify when a device has been placed in isolation, ensuring awareness of restricted network access. The banner only appears when the desktop UI is open or minimized.
For more details about the Endpoint User Interface, refer to Deploying the Endpoint User Interface.
Enhancements
Exclusions count
The total number of exclusions now appears next to the Exclusions section in each Datto AV policy. This enhancement makes it easy to track and manage your policy exclusions, even for large lists, saving you time and eliminating the need for manual counting.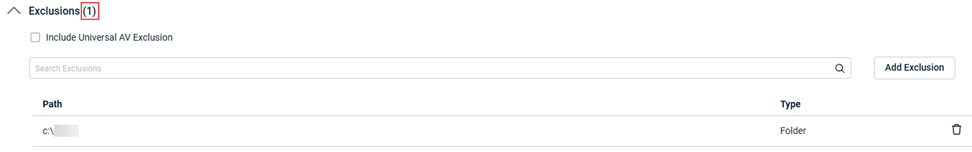
Analyst Datto AV File submissions
Users with the Analyst role can now perform Datto AV file submissions, a permission previously restricted to Admins. The change enhances operational flexibility for security teams by allowing more users to submit files for malware analysis.
Alerts export limit increased
You can now export more than 200 alerts at once from the Alerts page without encountering errors.
Datto AV scan history
You can now view and export Datto AV scan history from the Device details page. The new Datto AV Scan History table provides a 90-day record of completed and failed scans, including Scan Time, Scan Type, and Status. Easily export this data as a CSV report for compliance or audit needs, giving you greater visibility and control over your device security posture.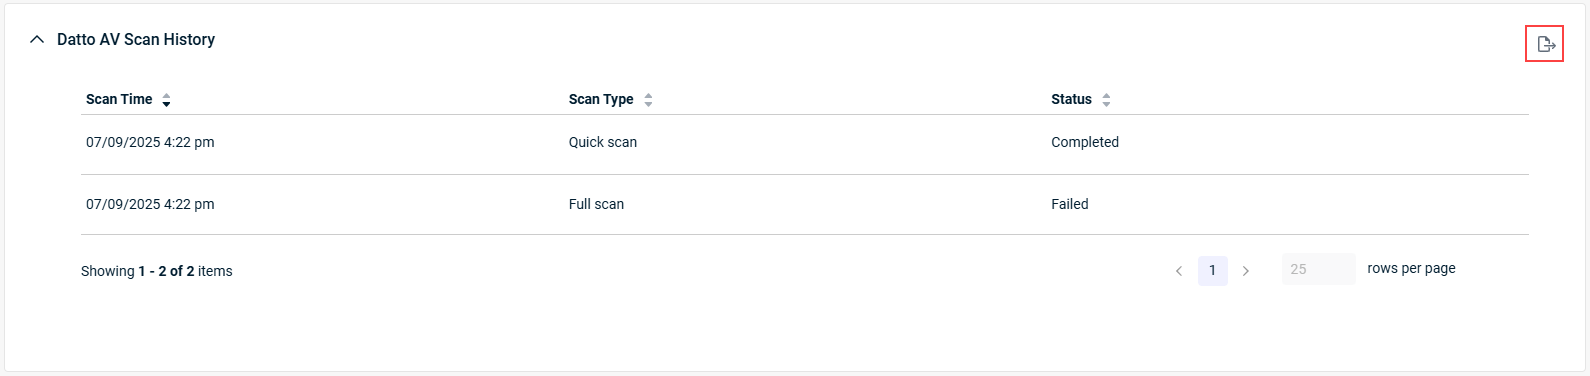
Fixes
- Resolved an issue where command-line telemetry contained Unicode characters and additional symbols.
- Fixed a UI limitation that restricted the device group dropdown to 25 entries.
- Corrected an issue where devices reported successful updates before completion; improved update verification checks.
- Fixed an issue where alert suppression failed when based on operating system (OS) criteria across all alert types in the platform. This update ensures that the failing property is consistently included in every alert source, improving the accuracy of alert suppression rules and reducing unwanted ticket creation in your environment.
- Resolved an issue where the EDR agent did not honor proxy configurations set in its configuration file. The agent now correctly uses the specified proxy for outbound communication, and provides clear logging when a proxy is configured or if a connection fails. If connections on the proxy fail, the agent will fallback to no proxy configuration to maintain connectivity to the platform.
Artifacts


