Getting started with the Dashboard page
NAVIGATION Dashboard
PERMISSIONS Datto EDR subscription with administrator, analyst, or external analyst-level platform access or Datto AV subscription with administrator, analyst, or external analyst-level platform access
BEFORE YOU BEGIN The type of subscription you have may define the features available to you on this page. For a comprehensive overview of features available to Datto EDR and Datto AV customers, refer to Datto EDR and Datto AV access control.
The Dashboard provides real-time and historical insights into license usage, alert activity, agent status, and overall environment health. Widgets are grouped by function and refresh at defined intervals to ensure accurate and timely visibility.
This article describes each Dashboard widget, its purpose, and how to interact with it.
Overview
- To access the Dashboard page, in the top navigation bar, click Dashboard.
- The page will load, displaying its widgets. The widgets refresh at different intervals which are documented in this article.
Clicking some of the widgets will take you directly to the page associated with the widget. This feature enables you to review and work with only the individual records for which the widget's total number is calculated.
IMPORTANT Specific retention periods apply to all record types in Datto EDR and Datto AV. For more information, refer to Datto EDR and Datto AV data retention policies.
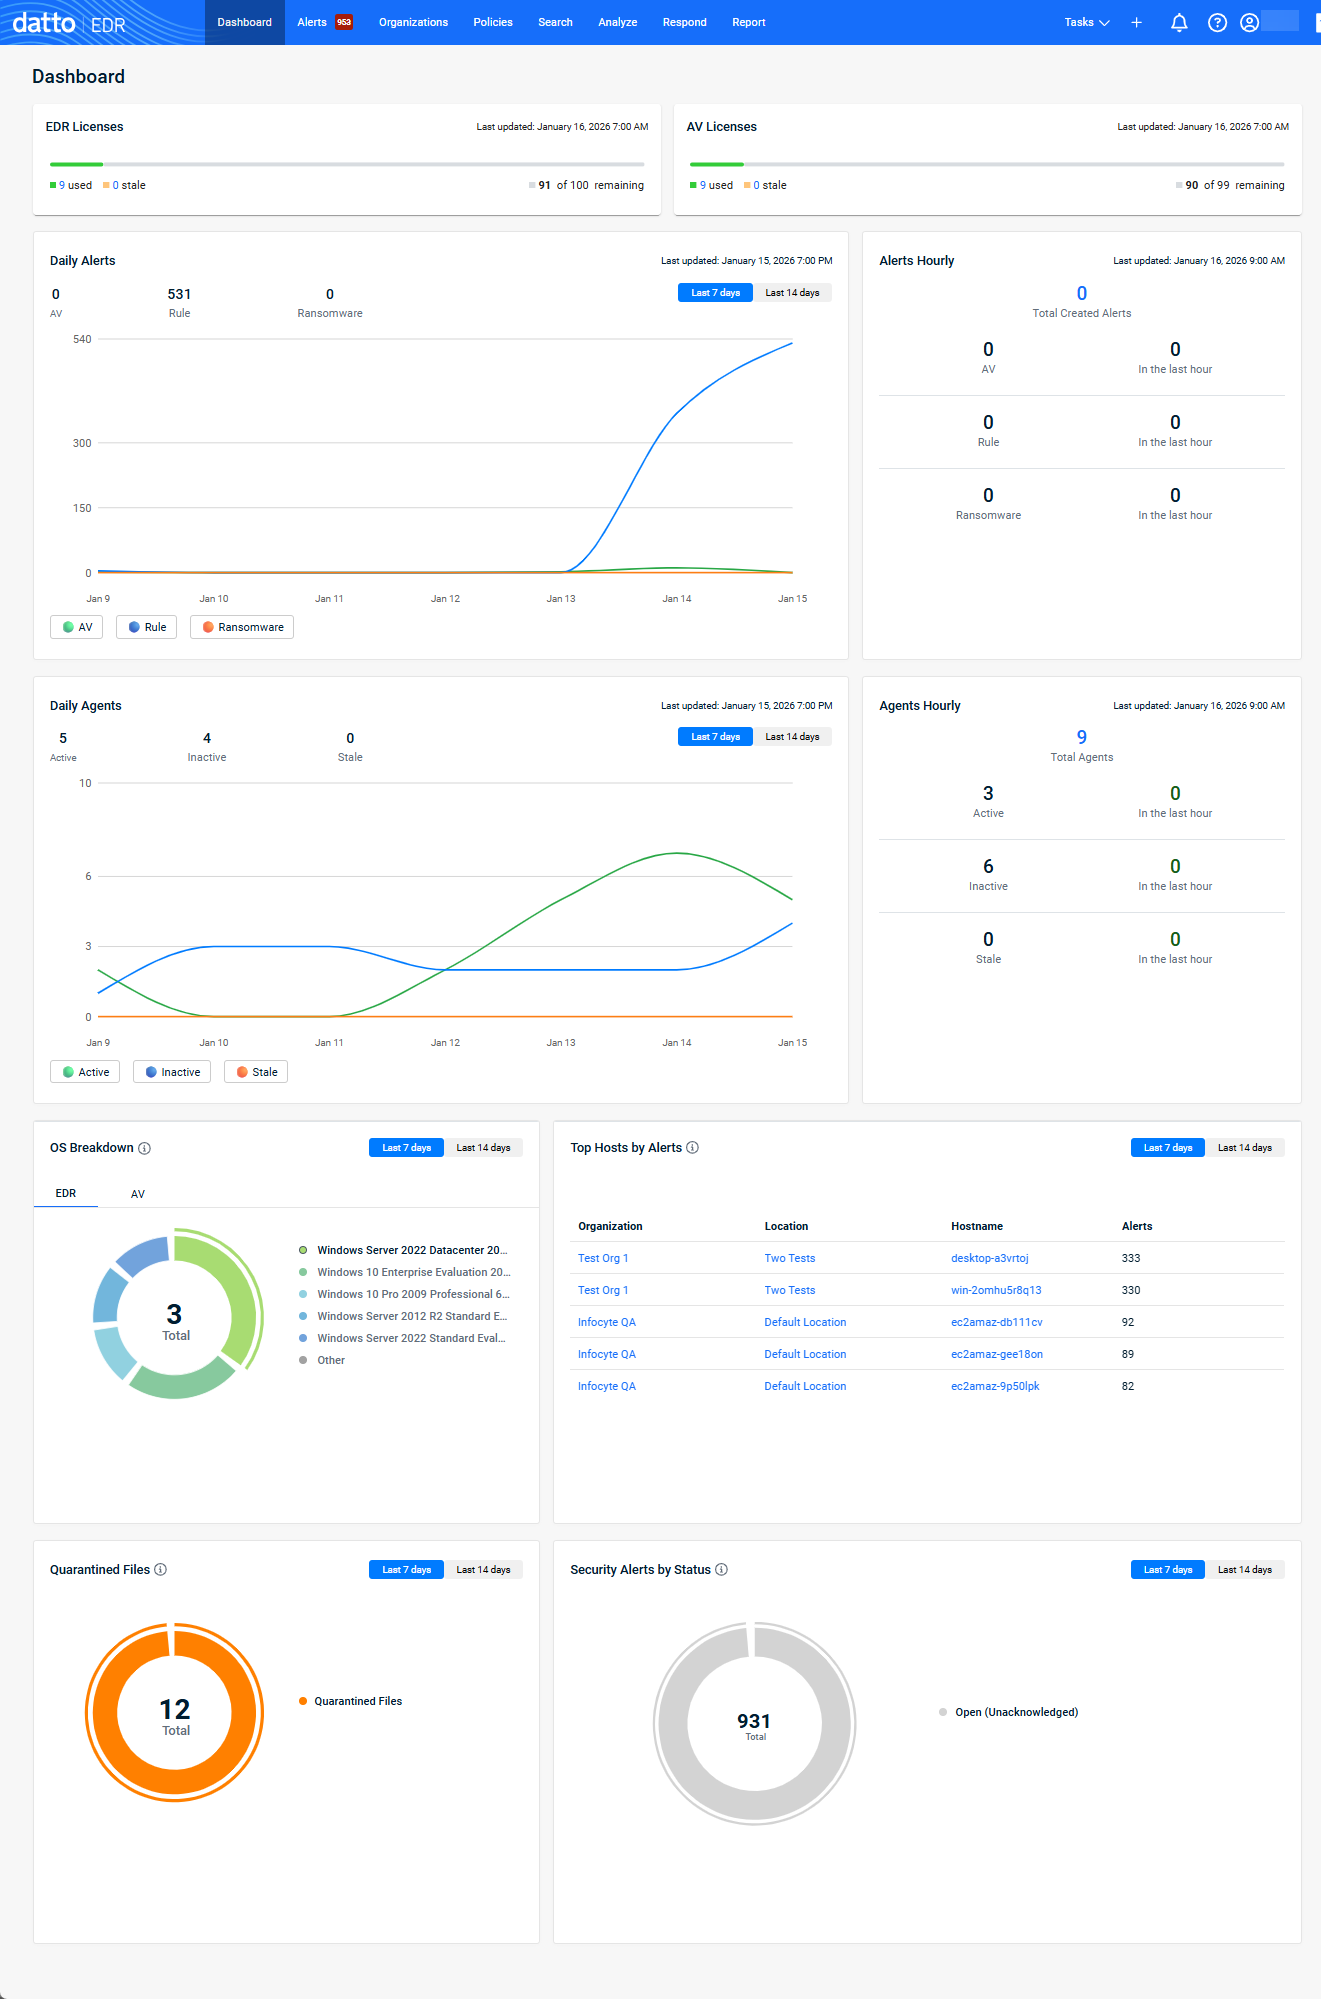
Dashboard widgets
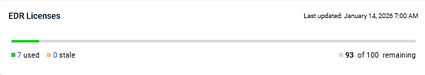
EDR Licenses
The EDR Licenses widget displays the number of EDR licenses currently in use within your EDR instance.
License statuses:
- Used (Green): Agents with an active EDR license that are not in a stale status.
- Stale (Yellow): Devices with an EDR license that have not checked in recently. For more information regarding EDR agent statuses, refer to Agent Status definitions.
- Remaining (Grey): Licenses available that have not been assigned to any device.
Additional Details:
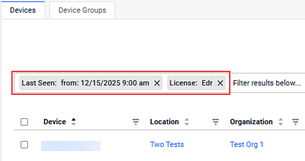
- Redirects: Clicking the number in the used or stale fields opens the Devices page filtered by EDR license type and selected status.
- Refresh Interval: Every 4 hours.
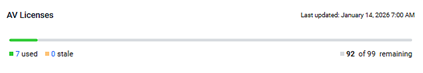
AV Licenses
The AV Licenses widget displays the number of AV licenses currently in use within your EDR instance.
License Statuses:
- Used (Green): Agents with an active AV license that are not in a stale status.
- Stale (Yellow): Devices with an AV license that have not checked in recently. For more information regarding EDR agent statuses, refer to Agent Status definitions.
- Remaining (Grey): Licenses available that have not been assigned.
Additional Details:
- Redirects: Clicking the number in the used or stale fields opens the Devices page filtered by AV license type and selected status.
- Refresh Interval: Every 4 hours.
Daily Alerts
The Daily Alerts widget displays a graph showing the number of alerts created each day by source type, helping you identify long-term trends. You can display data for the last 7 days or 14 days.
Additional Details:
- Refresh Interval: Every 24 hours.
- Hover feature: Hover over the graph to display the alert count for a selected date.
Alerts Hourly
Gain real-time visibility into alert activity with the Alerts Hourly widget. This feature provides a tactical view of alert generation in your EDR instance, refreshing every hour to display the number of alerts created by source type. By monitoring hourly trends, you can quickly identify and respond to spikes tied to specific sources, ensuring faster threat mitigation.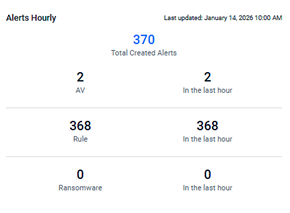
Additional Details:
- Redirects:
- Clicking a source filters the Alerts page for the selected source for the past hour.
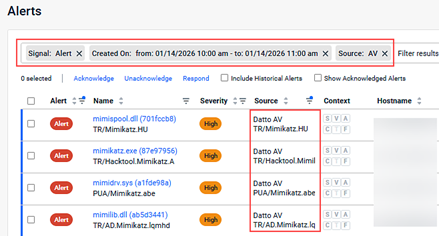
- Clicking Total Created Alerts filters the Alerts page for all sources for the past hour.
- Clicking a source filters the Alerts page for the selected source for the past hour.
- Refresh Interval: Every hour.
Daily Agents
The Daily Agents widget displays a graph indicating the number of devices by agent status for each day, helping you identify agent health. You can display data for the last 7 days or 14 days.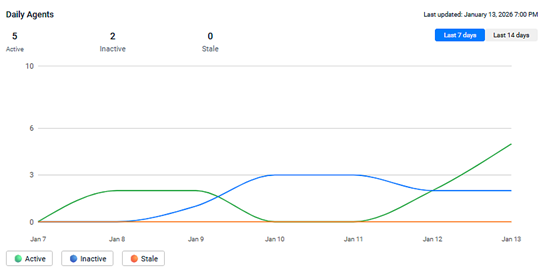
Additional Details:
- Refresh Interval: Every 24 hours.
- Hover feature: Hover over the graph to display the status count for a selected date.
Agents Hourly
Gain real-time visibility into device status with the Agents Hourly widget. This widget displays the number of devices and their statuses for your EDR instance, refreshing every hour. By monitoring hourly trends, you can quickly identify and address issues impacting agent health.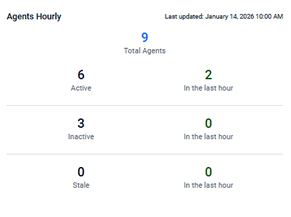
Additional Details:
- Redirects: Clicking any status opens the Devices page filtered by the selected status.
- Refresh Interval: Every hour.
The following widgets share common features:
- Refresh Interval: Once per day.
- Supported timeframes: Last 7 Days, Last 14 Days.
OS Breakdown
The OS Breakdown widget visualizes device distribution by operating system for the selected timeframe. You can view this breakdown by license type.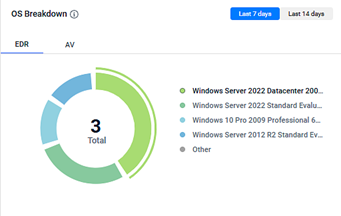
Top Hosts by Alerts
This widget identifies devices, locations, or organizations generating the most alerts during the selected timeframe. Use this data to review devices for possible exclusions, suppressions, or custom responses (named policies) in combination with other security controls like user security awareness training.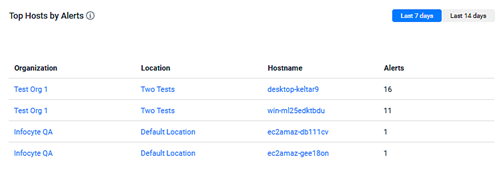
For more information on these topics, refer to the following Knowledge Base articles:
- Working with exclusions in your Datto AV policy
- Suppressing alerts
- Custom responses (named policies)
Quarantined Files
The Quarantined Files widget displays the number of files quarantined by the Datto AV engine during the selected timeframe. For detailed information, select Respond > Quarantined Files.
For more information, see the article Responding to alerts.
Security Alerts by Status
This widget displays alerts grouped by status (Acknowledged or Unacknowledged) during the selected timeframe, helping you assess alert backlog and response levels.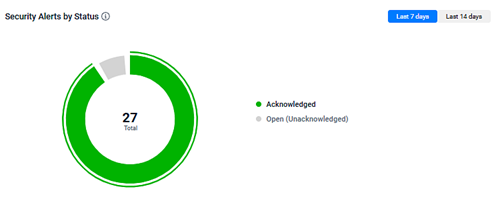
| Revision | Date |
|---|---|
| Global revisions. | 1/16/26 |


