Using the Analyze page
NAVIGATION Analyze
SECURITY Datto EDR subscription with administrator or analyst-level platform access
IMPORTANT Specific retention periods apply to all record types in Datto EDR and Datto AV. For more information, refer to Datto EDR and Datto AV data retention policies.
The Analyze page is where you'll inspect scan results when hunting for forensic evidence of malicious activity. It enables you to deeply inspect individual hosts, processes, user accounts, and more.
This article describes the page's layout and functions.
Overview
-
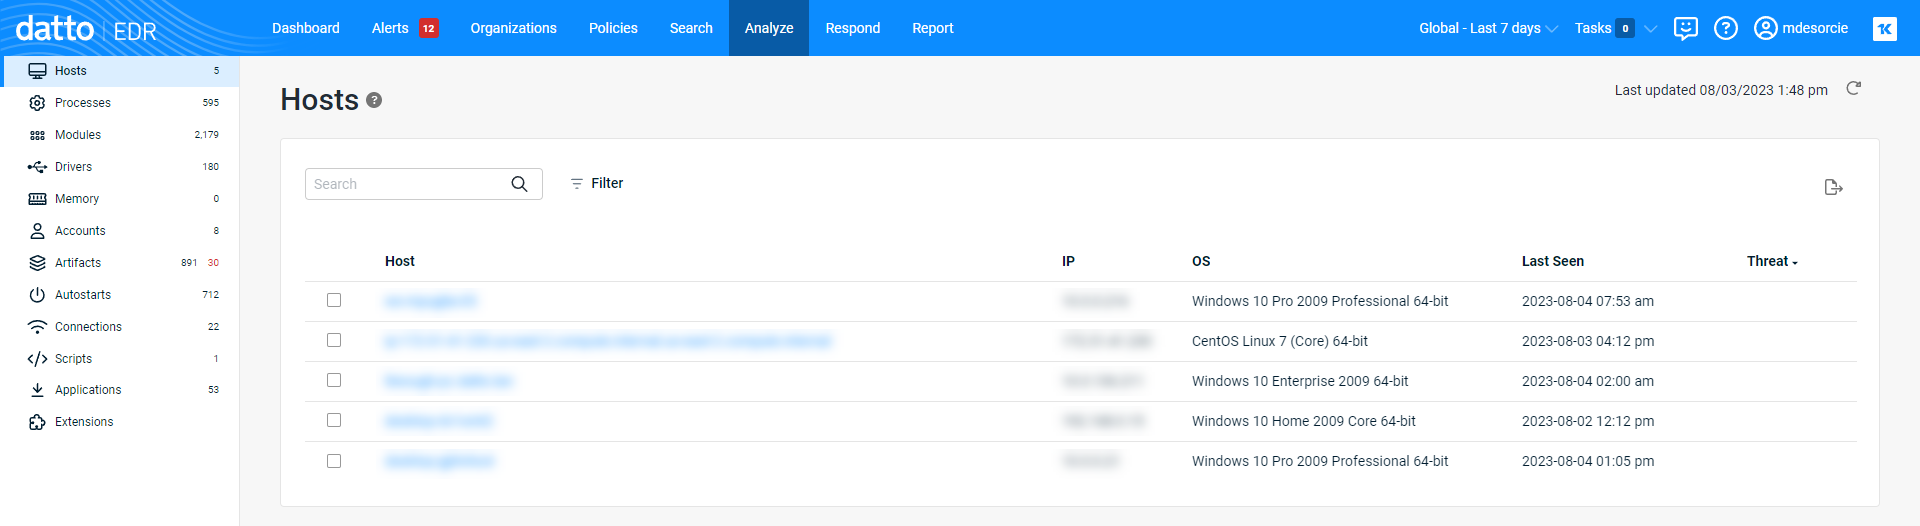
To access the Analyze page, in the top navigation menu, click Analyze.
-
As you begin to work with the page, you'll notice that the data appearing here is deduplicated, consolidating multiple process logs into single lines so you can quickly scan through large volumes of collected telemetry.
NOTE If you have an aggregation from the last seven days that contains an alert, that alert will still appear in the report until the timestamp falls off the timeline. This includes "Compromised" alerts.
| Feature | Definition |
|
Time box drop-down
|
Click to select or create a pre-defined time box filter for designated locations NOTE Once you have selected a filter, click |
|
|
Filters the returned results to a designated date range |
|
|
Assign a user-defined workflow or status category to the selected items; to create and personalize flags, visit |
|
|
Perform a threat analysis against selected items or all items in the current filter |
|
|
Exports the current report to a Comma-Separated Values (CSV) file; to export the records for only certain hosts, check the corresponding boxes to the left of the hosts' names |
|
|
Refresh the data in the current view |

The following links are available in the page's left navigation pane. Clicking any link opens a pivot report filtered to the selected topic. For detailed definitions of the fields that appear in each report, refer to the Page columns section of this article.
| Name | Function |
|
Hosts |
During discovery, EDR collects data on all endpoints on the network, including OS version, open ports, and remote access protocols. Enumerated here are all endpoints from which the platform has received telemetry data. |
|
Processes |
EDR captures a list of currently running programs and their metadata. The report is stacked by signature, so there are no duplicates of the same processes across different host in the list, unless their hashes are different. In that case, the processes may have different versions or potentially malicious code injected. |
|
Modules |
Appearing in this report is metadata for all libraries and all current users. It is common to see .DLL files from Windows hosts and .SO files from Linux-based hosts. |
|
Drivers |
Drivers normally run with administrator-like permissions and are digitally signed by their manufacturer to ensure authenticity. Datto EDR monitors all drivers that load on an endpoint, along with their metadata, and surfaces that information in human-readable format. |
|
Memory |
EDR searches process (volatile) memory for anomalies similar, but not limited to, how Volatility’s MALFIND operates. Malware can also be injected into memory and run without a file from the hard disk. This information represents the findings of that scan. |
|
Accounts |
To determine if account credentials have been compromised, EDR collects data for all system and domain users and compares it against accounts with currently running malware. |
|
Artifacts |
Enumerated here are the results of a Shimcache (aka "AppCompatCache") inspection. The information returned is a list of all recently executed binaries, and if available, the corresponding executable & parse metadata. |
|
Autostarts |
From this location, you can review all processes or scripts that run as soon as the operating system boots up. |
|
Connections |
EDR collects the network connections for each process with the network status of LISTENING or ESTABLISHED and reports that information here. |
|
Scripts |
To help you identify potentially malicious commands being carried out on your protected hosts, EDR collects all scripts currently executed in memory, all strings inside those scripts, and all references within those scripts, and details them on this page. |
|
Applications |
This page provides a list of all installed applications on the endpoint, including out of date or unwanted applications, along with applications that should be installed but aren’t, including antivirus software. |
|
Extensions |
From this page, you can search through the logs of an extension that executed on an endpoint. To learn more about working with extensions, refer to Leveraging collection and response extensions. |
The following tables define the default information provided in each pivot report available from the page's left navigation pane. Select a topic to learn more.
| Column header | Definition |
|
Host |
Assigned hostname of the endpoint |
|
IP |
IP address of the host |
|
OS |
Operating system installed on the endpoint. |
| Last Seen | Last date and time that the EDR platform received telemetry from the host. |
|
Threat |
EDR's assessment of the risk level of the object; when associated with a host, indicates whether or not the endpoint appears to have been compromised |
| Column header | Definition |
|
Flag |
User-defined workflow or status category to which the logged item belongs; to create and personalize flags, visit  > Admin > File Flags > Admin > File Flags |
|
Processes |
The specific processes run on the host during the selected reporting period |
|
Count |
The number of times the process executed during the selected reporting period |
|
Context |
The file-based reputation of the object; for more information, refer to the Understanding context section of this article |
|
Threat |
EDR's assessment of the risk level of the object; when associated with a host, indicates whether or not the endpoint appears to have been compromised |
|
|
Invokes a list of additional actions you can take against the selected object |
| Column header | Definition |
|
Flag |
User-defined workflow or status category to which the logged item belongs; to create and personalize flags, visit > Admin > File Flags |
|
Modules |
Identity of the self-contained unit or item which performs a defined task and can be linked with other such units to form a larger system |
|
Count |
The number of instances found for the object's name, path, or sha1 |
|
Context |
The file-based reputation of the object; for more information, refer to the Understanding context section of this article |
|
Threat |
EDR's assessment of the risk level of the object; when associated with a host, indicates whether or not the endpoint appears to have been compromised |
|
|
Invokes a list of additional actions you can take against the selected object |
| Column header | Definition |
|
Flag |
User-defined workflow or status category to which the logged item belongs; to create and personalize flags, visit > Admin > File Flags |
|
Drivers |
Name or identity of the driver |
|
Count |
The number of instances found for the object's name, path, or sha1 |
|
Context |
The file-based reputation of the object; for more information, refer to the Understanding context section of this article |
|
Threat |
EDR's assessment of the risk level of the object; when associated with a host, indicates whether or not the endpoint appears to have been compromised |
| Column header | Definition |
|
Flag |
User-defined workflow or status category to which the logged item belongs; to create and personalize flags, visit > Admin > File Flags |
|
Injection |
Processname-sha1 over the path of the injected process; the sha1 is the hash of the application code that is injected into the named process |
|
Size |
Size of the data involved in the memory operation |
|
Protection |
All memory protection flags observed during the scan |
|
Threat |
EDR's assessment of the risk level of the object; when associated with a host, indicates whether or not the endpoint appears to have been compromised |
| Column header | Definition |
|
Account |
The user account's name |
|
Domain |
The domain with which the user account is associated |
|
Privilege |
Level of operator privilege the specified user account holds on the associated endpoint |
|
Count |
The number of instances found for the object's name, path, or sha1 |
|
Logins |
Total number of logins performed by the specified user account on the associated endpoint |
|
Threat |
EDR's assessment of the risk level of the object; when associated with a host, indicates whether or not the endpoint appears to have been compromised |
| Column header | Definition |
|
Flag |
User-defined workflow or status category to which the logged item belongs; to create and personalize flags, visit > Admin > File Flags |
|
Artifacts |
The identity of the file or reference to the file that recently executed some time in the past |
|
Count |
The number of instances found for the object's name, path, or sha1 |
|
Context |
The file-based reputation of the object; for more information, refer to the Understanding context section of this article |
|
Threat |
EDR's assessment of the risk level of the object; when associated with a host, indicates whether or not the endpoint appears to have been compromised |
| Column header | Definition |
|
Flag |
User-defined workflow or status category to which the logged item belongs; to create and personalize flags, visit |
|
Autostarts |
Any process or script that will be run as soon as the operating system boots up and without any user authentication or warning |
|
Count |
The number of instances found for the object's name, path, or sha1 |
|
Context |
The file-based reputation of the object; for more information, refer to the Understanding context section of this article |
|
Threat |
EDR's assessment of the risk level of the object; when associated with a host, indicates whether or not the endpoint appears to have been compromised |
|
|
Invokes a list of additional actions you can take against the selected object |
| Column header | Definition |
|
Destination IP |
Target IP address of the outbound connection from the host |
|
Count |
Total number of connection attempts to the destination IP during the selected reporting period |
| Column header | Definition |
|
Flag |
User-defined workflow or status category to which the logged item belongs; to create and personalize flags, visit |
|
Scripts |
The MD5 hash of the executed script and the path of the application that invoked it; types are one of the following:
|
|
Count |
The number of instances found for the object's name, path, or sha1 |
|
Context |
The file-based reputation of the object; for more information, refer to the Understanding context section of this article |
|
Threat |
EDR's assessment of the risk level of the object; when associated with a host, indicates whether or not the endpoint appears to have been compromised |
| Column header | Definition |
|
Application |
Program listed within the host registry as an installed application |
|
Version |
Software version of the application |
|
Count |
The number of instances found for the object's name, path, or sha1 |
|
Flag |
User-defined workflow or status category to which the logged item belongs; to create and personalize flags, visit |
| Column header | Definition |
|
Process Name |
Name of the extension executed on the endpoint |
|
Count |
Total number of times the extension executed on the endpoint during the selected reporting period |
File context is an important data point to help you weigh whether or not an object is a threat. It is the file-based analysis of the object in question that complements the other behavioral analysis information available to you. You should always take both context and behavior into consideration when evaluating a threat.
-
For example, your behavioral analysis may not have seen the object engaging in any suspicious behavior, but the context analysis indicates that over 20 antivirus engines have flagged it as malicious.
-
Conversely, the context might indicate that a certain object hasn't been flagged by any antivirus engines as suspicious, but your behavioral analysis indicates that it is actually a malicious script that's deleting critical system files.
The Context details will show you one or more icons representing information that the analysis engine found about the object and any actions that it took to further the analysis. When they appear, you can move your mouse over them for additional details.
The following table provides expanded definitions of these icons:
| Icon | Legend | Definition |
|
|
Unable to analyze file |
The engine was unable to perform analysis on the object for an unknown reason. |
|
|
Included in a package manager |
Objects included in a package manager tend to be less likely to be malicious than unmanaged objects. |
|
|
Number of antivirus engines that have flagged the file |
The more antivirus engines that have flagged the file as malicious, the higher the likelihood is that it may be malicious. |
|
|
Submitted for static analysis |
If there is insufficient reputation information about the object, but early indications are that it may be malicious, the threat analysis engine will submit the object and its hash to the Datto cloud for AI-driven machine learning and review. |
|
|
Signed |
Most malware is unsigned. A digitally signed object is inherently less likely to be malicious than one that is unsigned. |
|
|
Linux only |
If the object is only available for Linux, the malware risk is lower, since most software for this platform comes from repositories. |
|
|
No threat intelligence results |
The engine did not find any threat intelligence information about this object. Proceed with caution. |
|
|
Not submitted for static analysis |
The object has not been submitted for static analysis either because there is adequate existing threat intelligence information about it or because there are not enough current indicators that the object is malicious to do so. |
|
|
Not signed |
The object does not have a digital signature. Proceed with caution. |
Good to know
This page delivers the additional functions listed below.
-
Click any header to sort the displayed records by the column's value.
-
Click any object or host name to open its summary detail page.


