Understanding the Search page
NAVIGATION Search
PERMISSIONS Datto EDR subscription with administrator or analyst platform access.
IMPORTANT Specific retention periods apply to all record types in Datto EDR and Datto AV. For more information, refer to Datto EDR and Datto AV data retention policies.
The Search page enables you to filter, sort, audit, and search granular telemetry records received from protected endpoints within the last nine months.
This article describes the page's layout and functions.
Overview
-
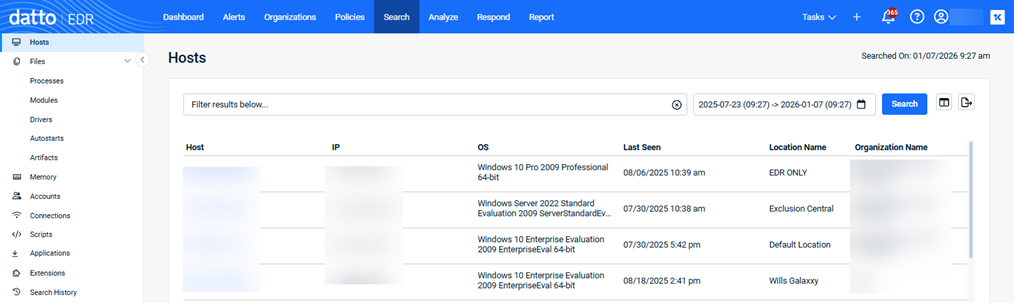
To access the Search page, in the top navigation bar, click Search.
-
The Hosts page is displayed by default. You can use this page to query a list of endpoints from which EDR has received telemetry data.
Continue through this document for complete descriptions of the Search pages.
| Feature | Definition |
| Search field |
Enter a partial or whole value to filter the records displayed. |

|
Filters the returned results to a designated time frame. 24 hours is the default. |
| Search | Executes a search. |

|
Enables user to configure which columns are visible and their order in the interface. |
|
|
Exports the current report to a Comma-Separated Values (CSV) file; to export the records for only certain hosts, check the corresponding boxes to the left of the hosts' names. |
The following pages are available in the left navigation menu. For detailed definitions of the table fields that appear on each page, refer to the Page columns section of this article.
| Name | Function |
|
Hosts |
During discovery, EDR collects data from all endpoints on the network, including details such as operating system version and IP address. This page lists all endpoints from which the platform has received telemetry data. |
|
Files |
This list is a consolidated index of all files discovered on all monitored endpoints during the selected reporting period. You can click any of the file type options below the Files link to display information for only that specific file type. The file types are described below. |
|
Processes |
EDR captures a list of currently running programs and their metadata. The report is stacked by signature so there are no duplicates of the same processes across different hosts in the list, unless their hashes are different. In that case, the processes may have different versions or potentially malicious code injected. |
|
Modules |
Appearing in this report is metadata for all libraries and all current users. It is common to see .DLL files from Windows hosts and .SO files from Linux-based hosts. |
|
Drivers |
Drivers normally run with administrator-like permissions and are digitally signed by their manufacturer to ensure authenticity. Datto EDR monitors all drivers that load on an endpoint, along with their metadata, and surfaces that information in human-readable format. |
|
Autostarts |
On this page, you can review all processes or scripts that run as soon as the operating system boots up. |
|
Artifacts |
The results of a Shimcache (aka "AppCompatCache") inspection are displayed here. The information includes a list of all recently executed binaries and, when available, the corresponding executable details and parsed metadata. |
|
Memory |
EDR searches process (volatile) memory for anomalies similar, but not limited to, how Volatility’s MALFIND operates. Malware can also be injected into memory and run without a file from the hard disk. This information represents the findings of that scan. |
|
Accounts |
To determine if account credentials have been compromised, EDR collects data for all system and domain users and compares it against accounts with currently running malware. |
|
Connections |
EDR collects the network connections for each process with the network status of LISTENING or ESTABLISHED and reports that information here. |
|
Scripts |
To help you identify potentially malicious commands being carried out on your protected hosts, EDR collects all scripts currently executed in memory, all strings inside those scripts, and all references within those scripts, and displays them on this page. |
|
Applications |
This page displays a list of all applications installed on the endpoint, including any that are out of date or unwanted. It also identifies applications that should be installed but are missing, such as antivirus software. |
|
Extensions |
From this page, you can search through the logs of an extension that executed on an endpoint. To learn more about working with extensions, refer to Leveraging collection and response extensions. |
|
Search History |
When users conduct searches within your EDR tenant, their query activity is journaled here. |
The following tables define the default information provided on each page available from the left navigation menu. Each page includes the Column Options icon which you can click to select the columns that appear on the page and arrange the columns in your preferred order. Select a page to learn more.
| Column header | Definition |
|
Host |
Assigned hostname of the endpoint. |
|
IP |
IP address of the host. |
|
OS |
Operating system installed on the endpoint. |
| Last Seen | Last date and time the EDR platform received telemetry from the host. |
The default columns displayed are the same for all of the file types (processes, modules, drivers, autostarts, artifacts).
| Column header | Definition |
|
File |
Name and location of the file. |
|
Type |
Identifies the file type. |
|
Context |
Includes icons that represent information identified by the analysis engine about the file. These indicators help you assess whether an object may pose a threat. See the section Understanding context. |
|
Host |
Host on which the file in located. |
|
Timestamp |
Date and time on which the file was discovered on the host. |
| Column header | Definition |
|
Injection |
Processname-sha1 over the path of the injected process; the sha1 is the hash of the application code that is injected into the named process |
|
Host |
Assigned hostname of the endpoint. |
|
Timestamp |
Last date and time the EDR platform received telemetry from the host. |
| Column header | Definition |
|
Name |
Name of the user account |
|
Domain |
Domain with which the user account is associated |
|
Privilege |
Level of operator privilege the specified user account holds on the associated endpoint |
|
Logins |
Total number of logins performed by the specified user account on the associated endpoint |
|
Host |
Assigned hostname of the endpoint. |
|
Timestamp |
Last date and time the EDR platform received telemetry from the host. |
| Column header | Definition |
|
PID |
Unique identifier of the process at the time it ran on the host |
|
Name |
Filename for most file-based objects, the hash of the memory content for memory injections, and the username for accounts |
|
Local:Port |
Local IP address and port on the local host from which the connection originated |
|
Remote:Port |
Destination IP address and port on the remote host to which the connection was directed |
|
Host |
Assigned hostname of the endpoint. |
|
Timestamp |
Last date and time the EDR platform received telemetry from the host. |
| Column header | Definition |
|
Script |
The MD5 hash of the executed script and the path of the application that invoked it; types are one of the following:
|
|
Context |
The file-based reputation of the object; for more information, refer to the Understanding context section of this article |
|
Host |
Assigned hostname of the endpoint. |
|
Timestamp |
Last date and time the EDR platform received telemetry from the host. |
| Column header | Definition |
|
Application |
Program listed within the host registry as an installed application |
|
Version |
Software version of the application |
|
Installed On |
Date when the application was installed on the endpoint |
|
Host |
Assigned hostname of the endpoint. |
|
Timestamp |
Last date and time the EDR platform received telemetry from the host. |
| Column header | Definition |
|
Name |
Name of the extension executed on the endpoint |
|
Hostname |
Assigned hostname of the endpoint. |
|
Timestamp |
Last date and time the EDR platform received telemetry from the host. |
|
Success |
Indicates the outcomes of the deployed response extensions |
|
Threat |
EDR's assessment of the risk level of the object. When associated with a host, indicates whether or not the endpoint appears to have been compromised. |
| Column header | Definition |
|
Search Keyword |
Terminology used during the search |
|
Filter criteria used during the search |
|
|
Date Range |
Designated range of time to which the search was limited |
|
Status |
Indicates whether the search completed or is in progress |
|
Timestamp |
Time and date when the search was conducted |
File context is an important data point to help you weigh whether or not an object is a threat. It is the file-based analysis of the object in question that complements the other behavioral analysis information available to you. You should always take both context and behavior into consideration when evaluating a threat.
-
For example, your behavioral analysis may not have seen the object engaging in any suspicious behavior, but the context analysis indicates that over 20 antivirus engines have flagged it as malicious.
-
Conversely, the context might indicate that a certain object hasn't been flagged by any antivirus engines as suspicious, but your behavioral analysis indicates that it is actually a malicious script that's deleting critical system files.
The Context details will show you one or more icons representing information that the analysis engine found about the object and any actions that it took to further the analysis. When they appear, you can move your mouse over them for additional details.
The following table provides expanded definitions of these icons:
| Icon | Legend | Definition |
|
|
Unable to analyze file |
The engine was unable to perform analysis on the object for an unknown reason. |
|
|
Included in a package manager |
Objects included in a package manager tend to be less likely to be malicious than unmanaged objects. |
|
|
Number of antivirus engines that have flagged the file |
The more antivirus engines that have flagged the file as malicious, the higher the likelihood is that it may be malicious. |
|
|
Submitted for static analysis |
If there is insufficient reputation information about the object, but early indications are that it may be malicious, the threat analysis engine will submit the object and its hash to the Datto cloud for AI-driven machine learning and review. |
|
|
Signed |
Most malware is unsigned. A digitally signed object is inherently less likely to be malicious than one that is unsigned. |
|
|
Linux only |
If the object is only available for Linux, the malware risk is lower, since most software for this platform comes from repositories. |
|
|
No threat intelligence results |
The engine did not find any threat intelligence information about this object. Proceed with caution. |
|
|
Not submitted for static analysis |
The object has not been submitted for static analysis either because there is adequate existing threat intelligence information about it or because there are not enough current indicators that the object is malicious to do so. |
|
|
Not signed |
The object does not have a digital signature. Proceed with caution. |
The following table lists the filters that can be applied for each Search page using the Filters field. It also identifies the columns that can be displayed or hidden on each page. * indicates a column is displayed by default.
| Page | Filters | Columns |
|---|---|---|
| Hosts |
|
|
|
Files
|
|
|
| Memory |
|
|
| Accounts |
|
|
| Connections |
|
|
| Scripts |
|
|
| Applications |
|
|
| Extensions |
|
|
Examples
The following are examples of applying filter criteria.
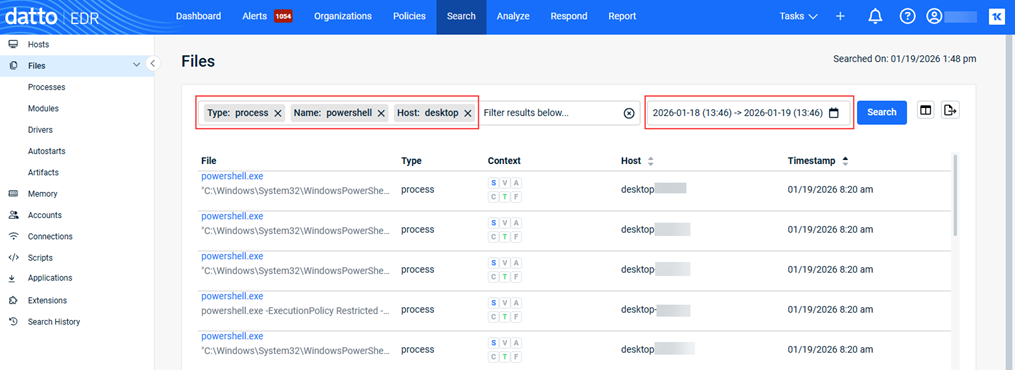
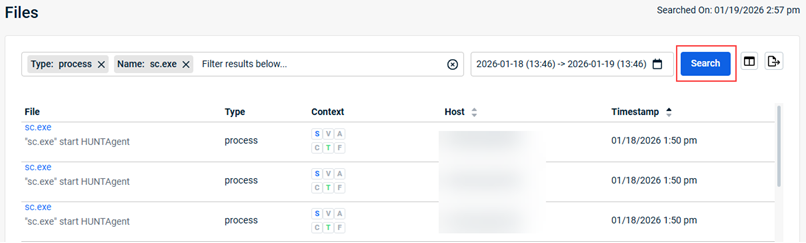
Example 1
Searching for PowerShell processes run on hosts whose names begin with desktop in the last 24 hours.
- Type: Processes
- Name: powershell
- Host: desktop
- Time frame: Last 24 hours
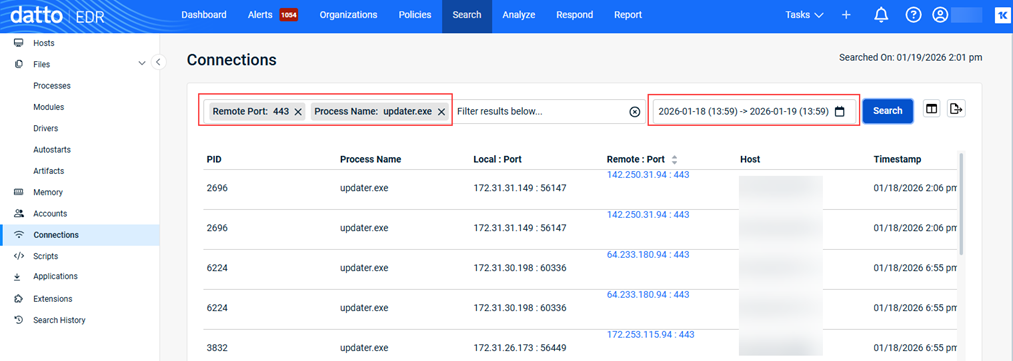
Example 2
Searching for connections made to remote port 443 with the process name updater.exe in the last 24 hours.
- Type: Connections
- Remote Port: 443
- Process Name: updater.exe
- Time frame: Last 24 hours
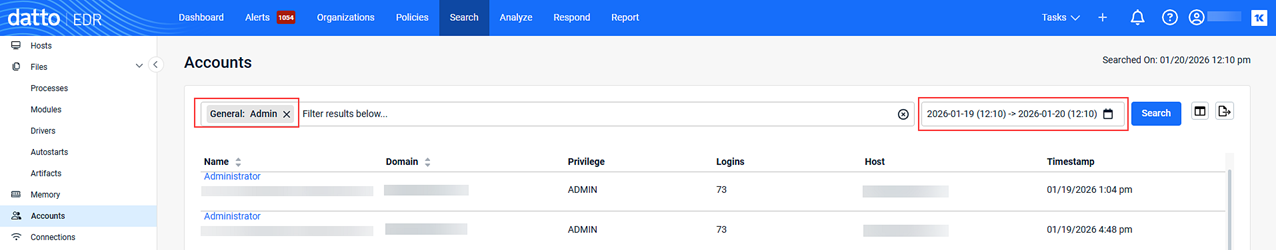
Example 3
Searching for the number of accounts logged in with admin level permissions during the last 24 hours.
- Type: Accounts
- General: Admin
- Time frame: Last 24 hours
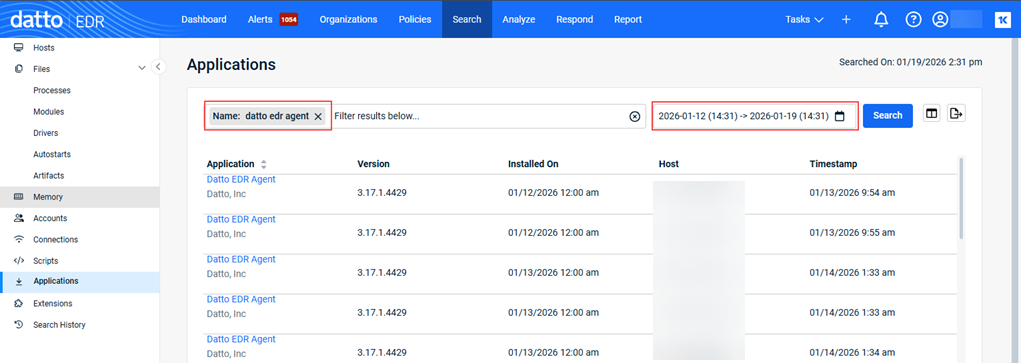
Example 4
Searching for Datto EDR Agent applications installed during the last seven days.
- Type: Applications
- Name: datto edr agent
- Time frame: Last seven days
You perform a search by navigating to the Search page and selecting a data type to use as the basis for your query. You can refine your results further by applying filters.
NOTE To initiate a search, you must click the Search button, even when using the default criteria (for example, the 24‑hour time frame).
- In the top navigation bar, click Search.
- In the left navigation menu, select the desired page (data type).
- To apply a filter:
- Click the Filter field. The filters available for the page are displayed.
Note: In step 2, if you selected one of the file types under Files, it is automatically selected in the Filter field.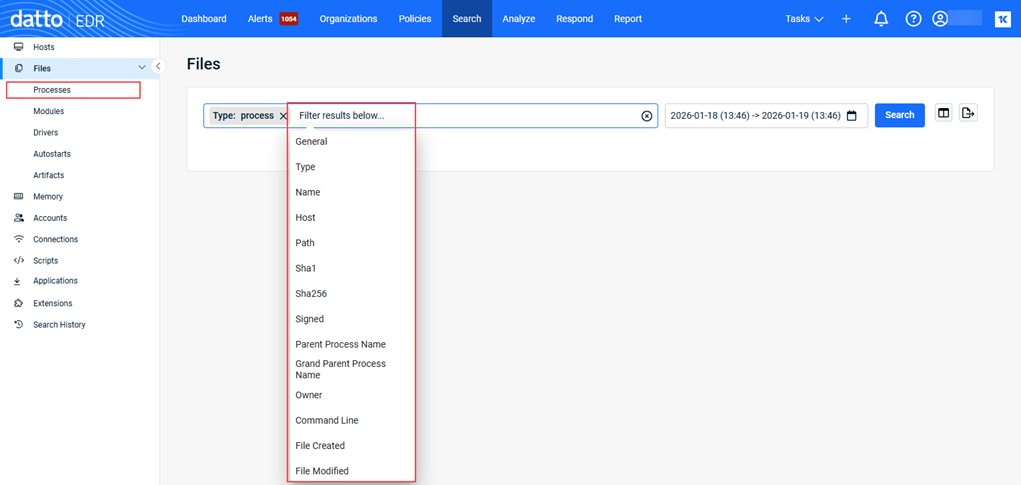
- Select the desired filter.
- Provide the filter criteria. Some filters support text search while others provide predefined lists.
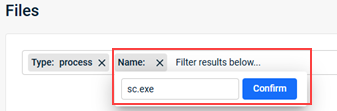
- Click Confirm.
- To apply another filter, repeat steps 3a through 3d.
- Click the Filter field. The filters available for the page are displayed.
- To select a time frame on which to base the search results:
- Click the calendar icon.

- To provide a specific date and time range, click Absolute. Select the desired start and end dates and times. Click Apply.
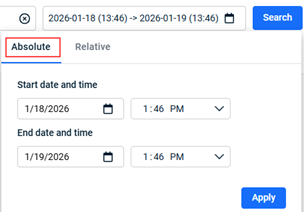
- To select a time frame based on the current date and time, click Relative. Select the desired start and end dates and times. Click Apply.
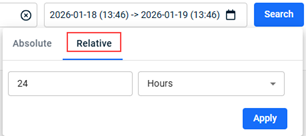
- Click the calendar icon.
- Click Search. The results are displayed.
| Revision | Date |
|---|---|
| Added section: Search page filters and column options. Added PR: Performing searches. | 1/23/26 |
| Permissions: Removed external analyst. | 2/23/26 |


