Navigating the Device details page
NAVIGATION Organizations > select an organization > select a location > select a device
SECURITY Datto EDR subscription with administrator or analyst-level platform access or Datto AV subscription with administrator or analyst-level platform access
BEFORE YOU BEGIN The type of subscription you have may define the features available to you on this page. For a comprehensive overview of features available to Datto EDR and Datto AV customers, refer to Datto EDR and Datto AV access control.
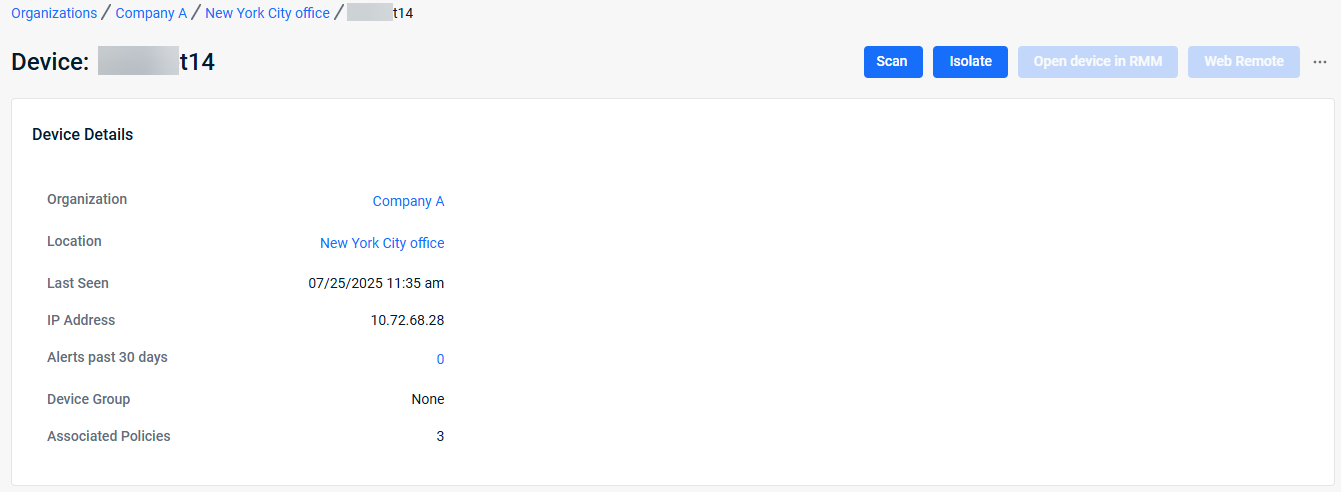
The Device details page provides in-depth information about a selected endpoint, including monitoring information, performance metrics, and alert enumeration. It also provides basic device management options.
This article describes the page's layout and functions.
Overview
- In the top navigation menu, click Organizations.
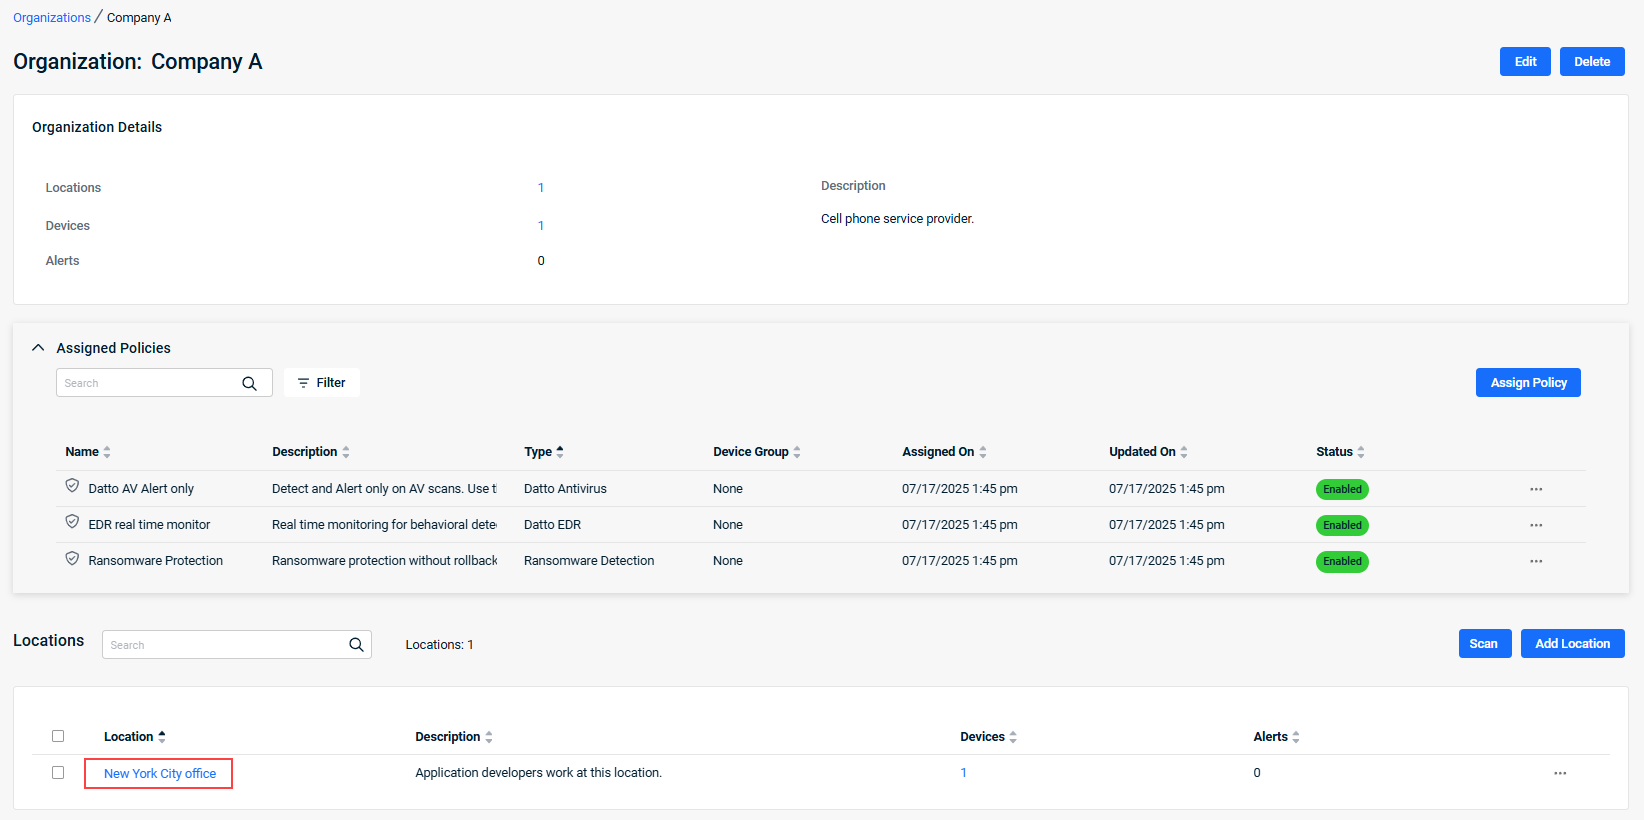
- In the Organization column, click the desired organization.
- In the Locations section, click the applicable location.

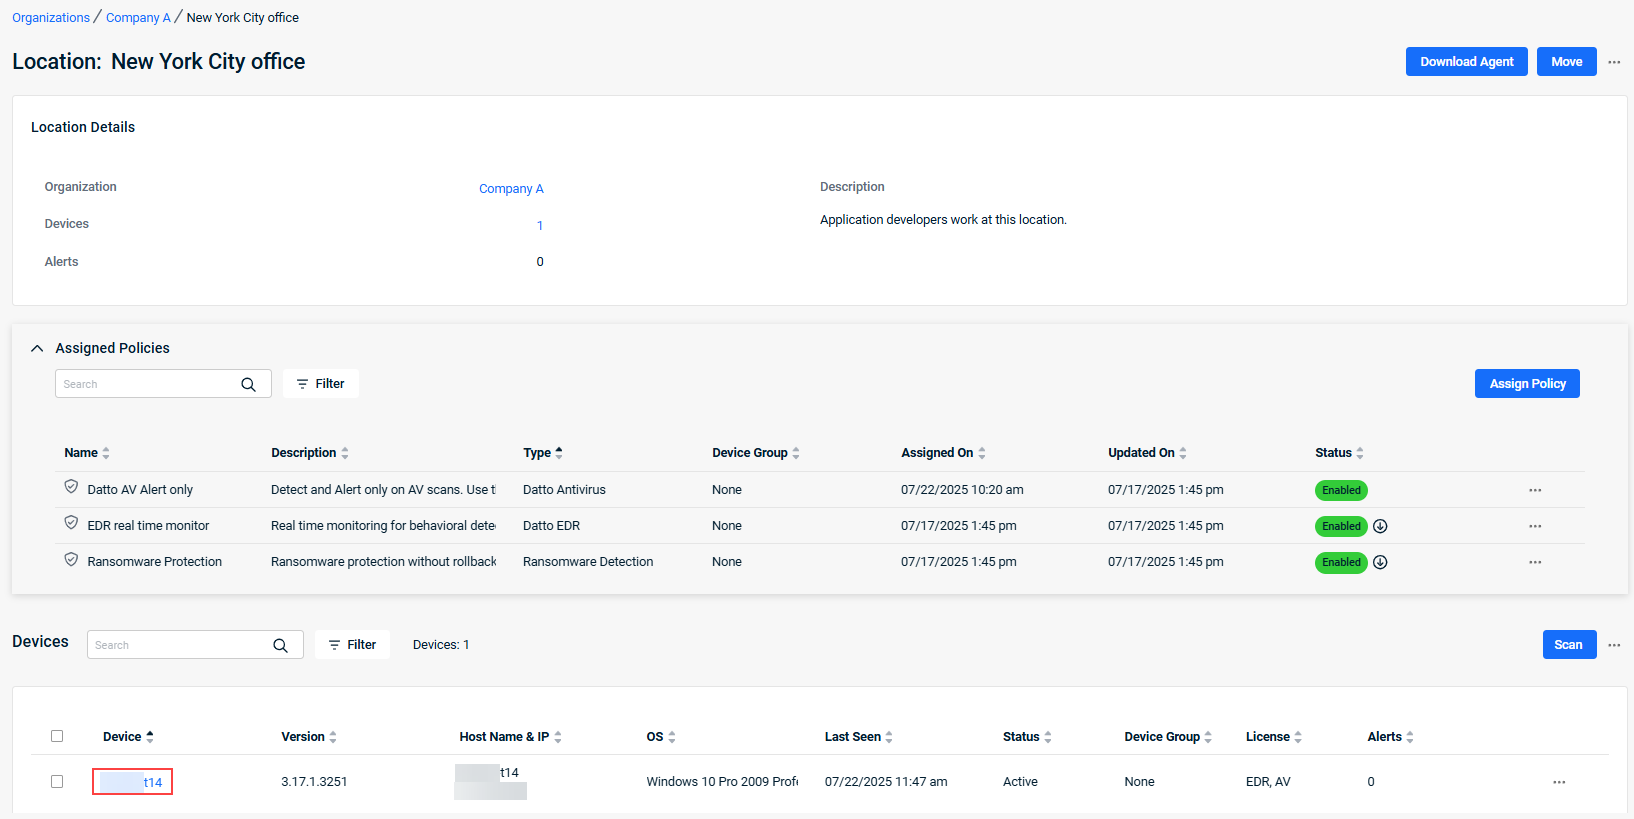
- The Location details page is displayed. In the Devices section, click the applicable device.
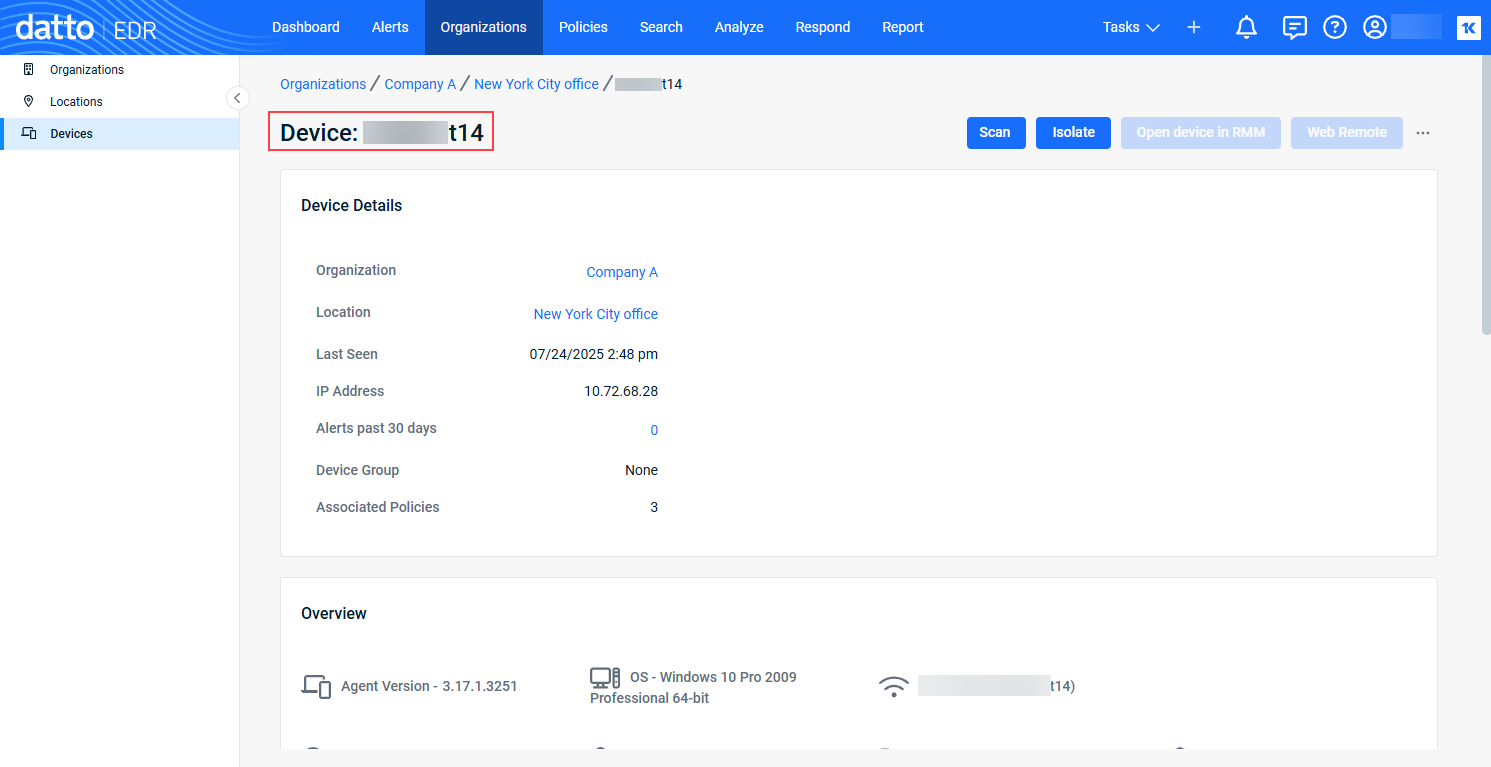
- The Device details page is displayed.

As you navigate the page, you'll see the features and fields described below.
Devices with an ![]() icon preceding their name are synced from Datto RMM. Learn more in our Understanding the Datto EDR + Datto RMM integration article.
Devices with an
icon preceding their name are synced from Datto RMM. Learn more in our Understanding the Datto EDR + Datto RMM integration article.
Devices with an  icon preceding their name are synced from VSA X. Learn more in the article Configuring the VSA 10 integration.
| Feature | Definition |
| Scan |
Runs an on-demand threat scan of the device; to learn more, review our Performing a manual scan article. |
| Isolate | Click to isolate the device from the rest of the network. |
|
Open device in RMM |
Button is active for devices synced from Datto RMM. Click to access device details in RMM. |
| Web Remote | Allows Datto EDR instance to start remote control session with RMM. |
|
Ellipses menu; provides options to delete, rename, or move the device. |

| Field name | Definition |
|
Organization |
Name of the organization. |
| Location | Location at which the device is located. |
|
Last Seen |
Last date and time that the EDR platform received telemetry from the host. |
| IP address | The current IP address and full hostname of the endpoint. |
| Device Group | Name of the device group the device belongs to, if any. |
| Associated Policies | Number of policies that apply to the device. |
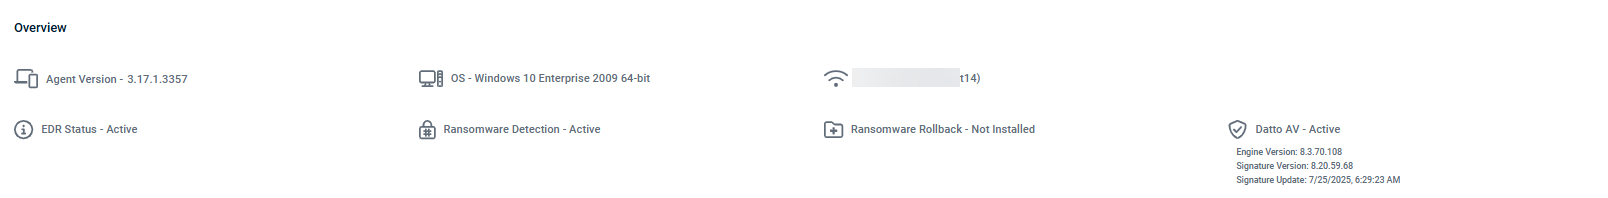
| Field name | Definition |
|
Agent Version |
The version of the Datto Endpoint Security agent installed on the endpoint. |
|
OS |
Operating system installed on the endpoint. |
| IP address and hostname | The current IP address and full hostname of the endpoint. |
IMPORTANT: Resolving agent activity and update issues
The following actions are recommended to resolve specific device status issues:
- Inactive or Stale: First, check if the endpoint is still online and under active management. If it is, you could run Datto EDR Force Reinstall and Upgrade [WIN] from RMM to bring the device back online. If you are not integrated with an RMM, an alternative option would be to restart the Datto EDR aka HUNTAgent locally or run a powershell script.
- Stuck in Pending Update or Update Failed state: Restart the Datto EDR aka HUNTAgent service. This should restart the attempt to update the agent. Also, you could attempt to reboot the machine.
- Disabled: In the device list within your EDR portal, for the applicable device, click the ellipses menu (
 ) in the last column and select Enable. The device will go back and attempt to update the version to the latest agent build.
In the event you are unable to successfully resolve the issue, contact Kaseya Support. Be sure to note the status of the device and any troubleshooting you performed. Also, you can select Organizations > All Devices and for the applicable device, click the ellipses menu (![]() ) in the last column, then select Fetch Logs. This will pull all current device and debug logs into the Reports section. The logs may be helpful to support when addressing the issue.
) in the last column, then select Fetch Logs. This will pull all current device and debug logs into the Reports section. The logs may be helpful to support when addressing the issue.
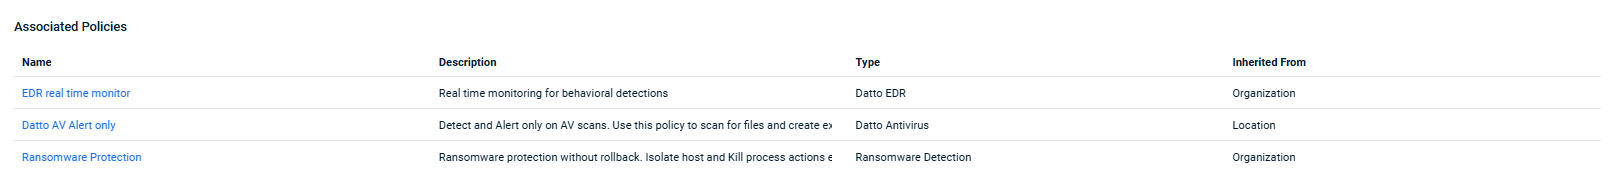
The Associated Policies table enables you to manage the location's assigned Ransomware Detection and Windows Defender policies. Learn more in Policy List.
| Field or feature name | Definition |
| Name |
The name of the policy. |
| Description |
The extended description of the policy's purpose, functions, and any other pertinent information. |
|
The type of policy. |
|
| Inherited From | Identifies how the policy is associated to the device. |
The System Metrics pane provides insights into storage and system usage on the endpoint.
| Report title | Definition |
|
File Sizes |
Reports cache versus log size activity on the monitored endpoint |
| System Usage |
Tracks overall CPU and memory usage on the endpoint against agent CPU and memory usage |


